 SPCVisuals
Press kit
Everything needed to write about us, without having to ask. If something is missing, say so and it gets added.
In one sentence
SPC Visuals turns quality measurements from a factory line into live statistical process control charts, with control limits locked to a baseline, automatic out-of-control alerts, and shop-floor displays anyone can read.
In a paragraph
Most factories still run statistical process control in spreadsheets, which means the chart is out of date by the time anyone sees it and the control limits quietly move whenever the data does. SPC Visuals connects to whatever the plant already produces — a CSV export, a PLC, an MES — and keeps X̄-R, X̄-s, I-MR and c charts current, with every limit set versioned and dated. It is priced per production line rather than per seat, and free to look at for everyone on the floor.
Facts
- What it is: multi-tenant SPC (statistical process control) software, in the browser.
- Charts: X̄-R, X̄-s, I-MR and c, with Nelson rules 1–8 configurable per characteristic.
- Hosting: EU, isolated per tenant.
- Pricing: per production line, from €169/month. Unlimited read-only viewers.
- Public demos: five control charts running on live public data at spcvisuals.com/live — no signup, no email.
- Free tools: Cp/Cpk, control limit and chart calculators, no signup.
Story angles that are actually true
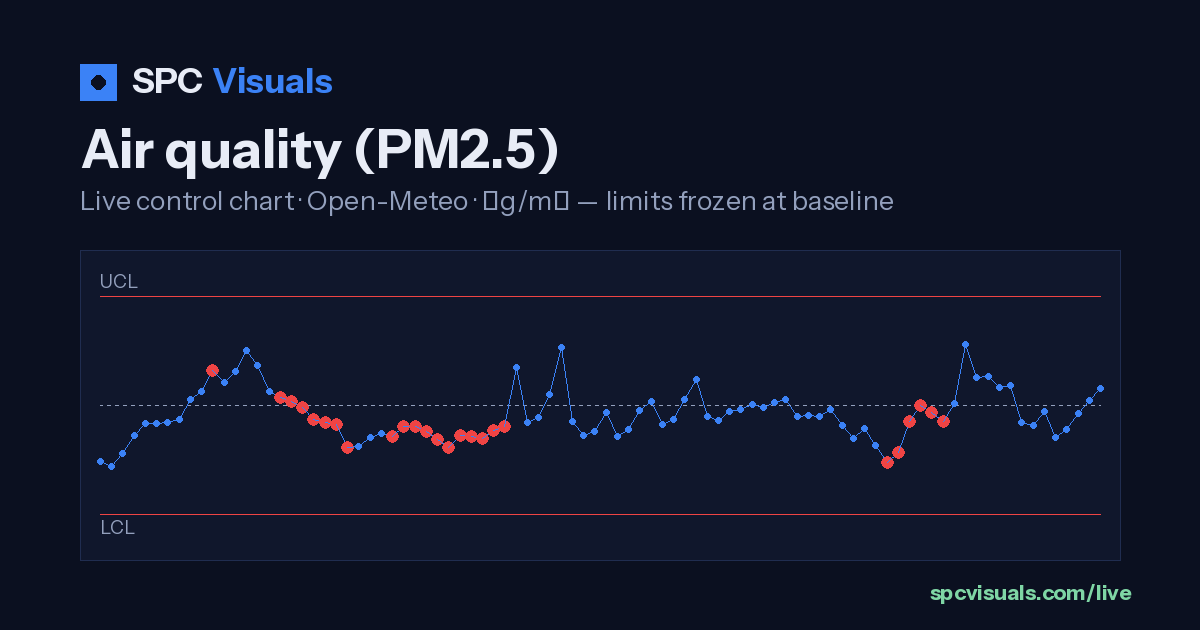
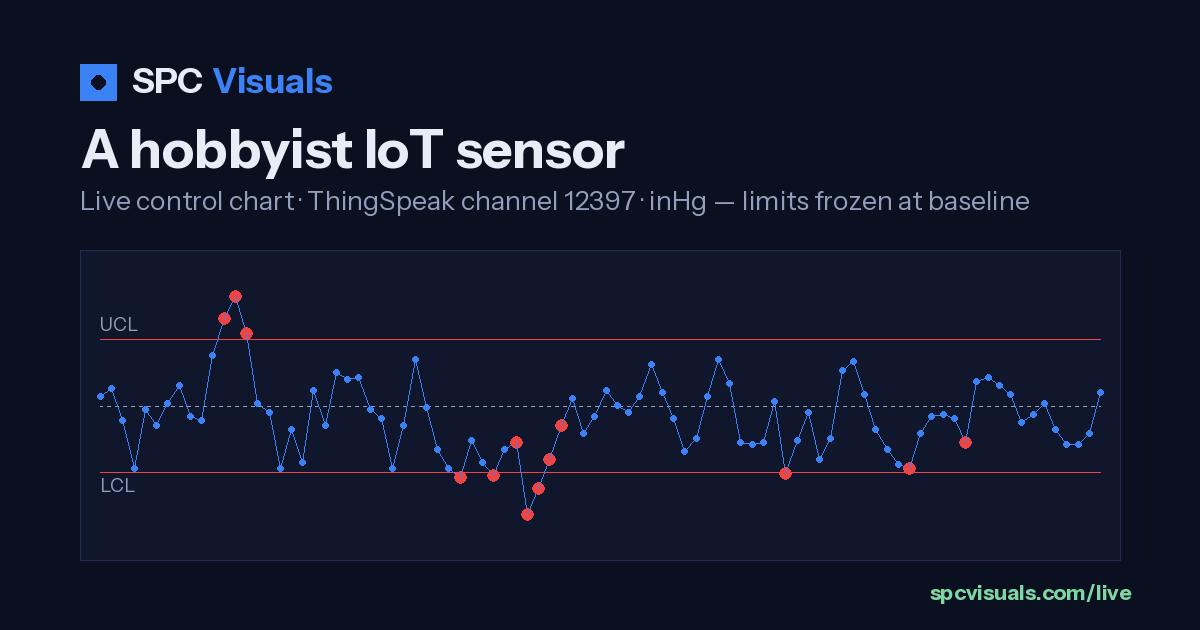
- Public data, real statistics. The live demos chart GB grid frequency, a UK river, European air quality, global earthquake counts and an IoT pressure sensor — with limits frozen at baseline like a real process.
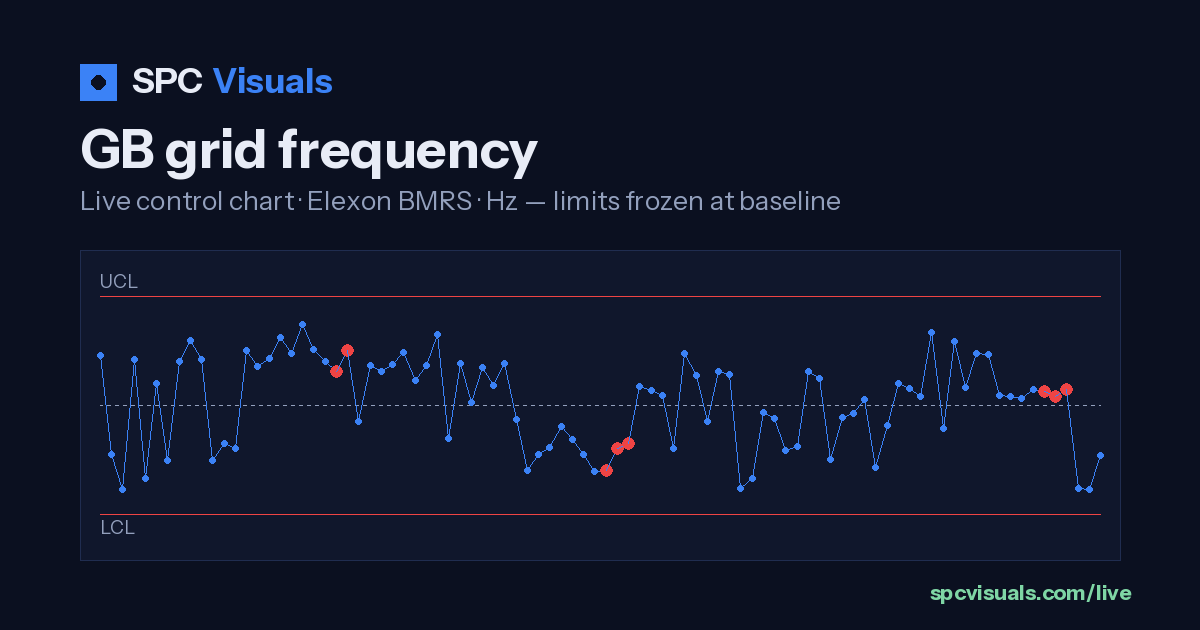
- Why a chart of fast data lies. Grid frequency at 15-second resolution puts 87.8% of points outside the control limits, because consecutive readings are 98.8% correlated. We wrote up what to do about it.
- SPC without the enterprise sale. A quality engineer can sign up, upload a CSV and have a working chart without talking to anyone.
Images
- Logo, SVG — mark only, 512px PNG. Both are drawn for a dark ground; please do not recolour them.
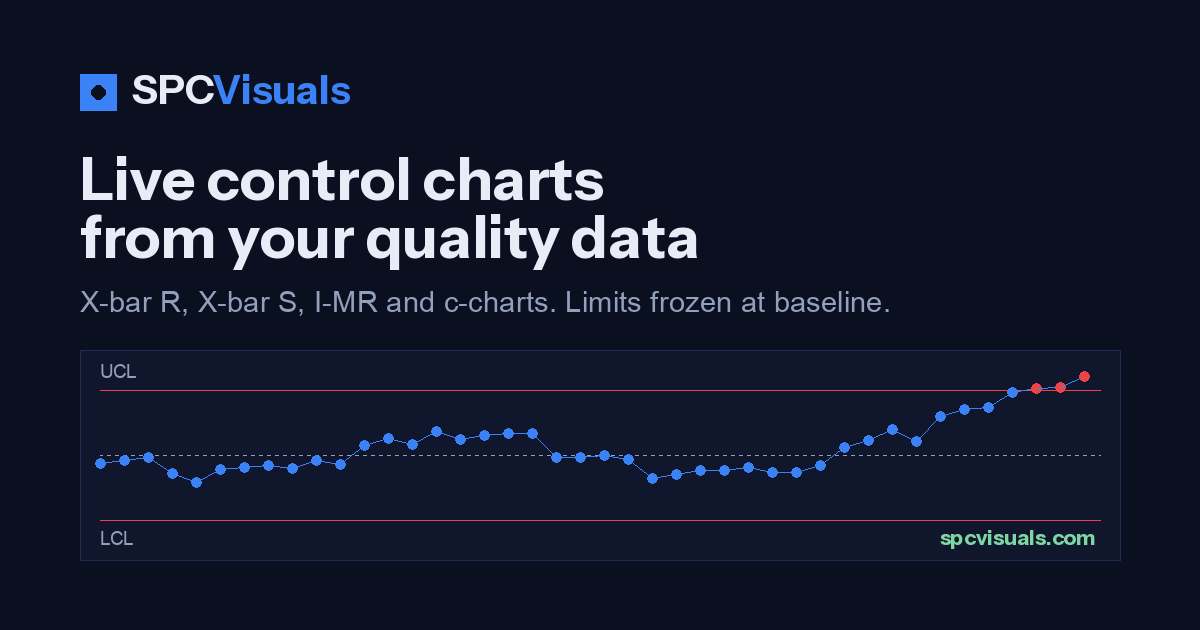
- Product card, 1200×630 PNG
- GB grid frequency — live chart card, 1200×630 PNG (generated from the current data, so it is never stale)
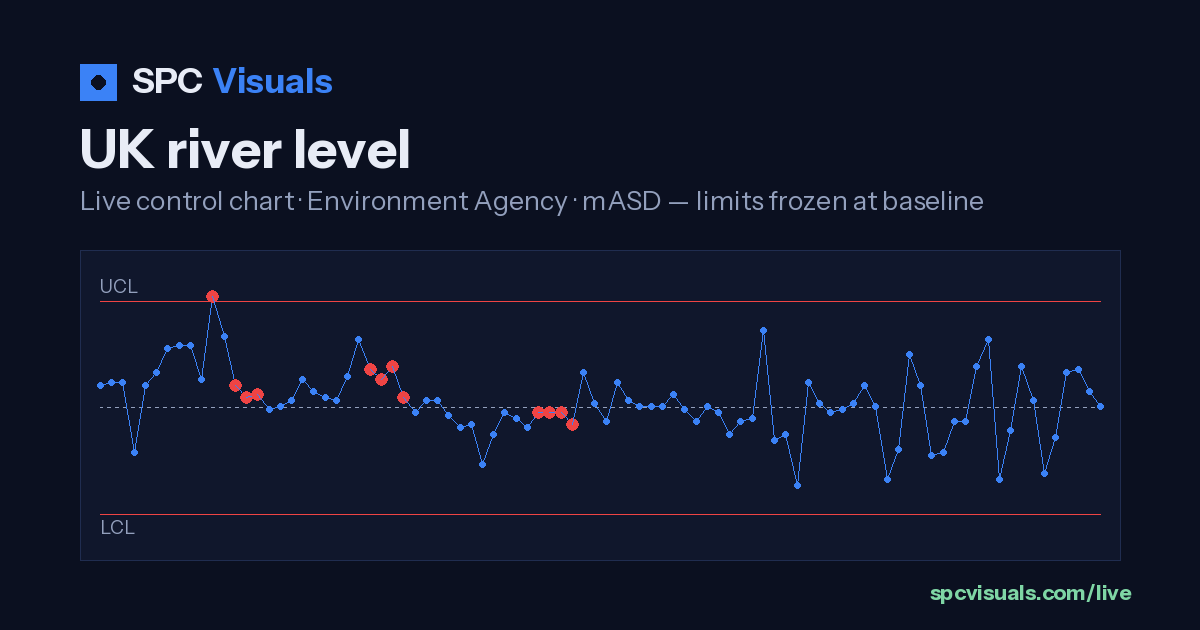
- UK river level — live chart card, 1200×630 PNG (generated from the current data, so it is never stale)
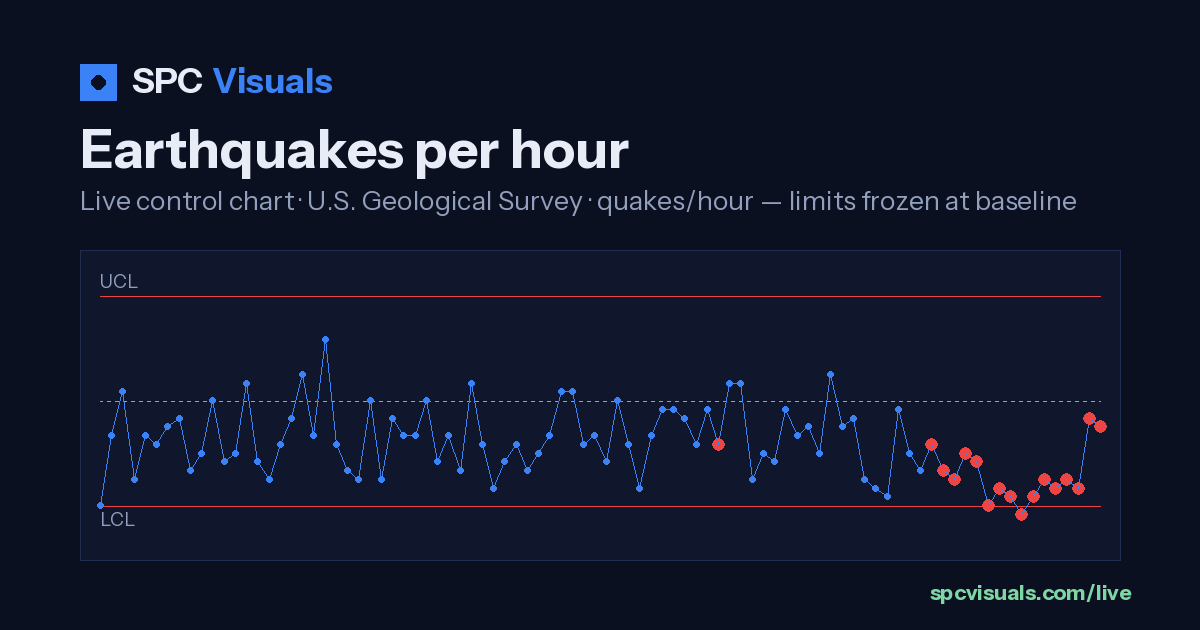
- Earthquakes per hour — live chart card, 1200×630 PNG (generated from the current data, so it is never stale)
- Air quality (PM2.5) — live chart card, 1200×630 PNG (generated from the current data, so it is never stale)
- A hobbyist IoT sensor — live chart card, 1200×630 PNG (generated from the current data, so it is never stale)



Images may be reproduced freely in coverage of SPC Visuals.
Embedding a live chart
Any of the live charts can be embedded, free and without asking:
<iframe src="https://www.spcvisuals.com/live/grid-frequency/embed"
        width="100%" height="440" style="border:0"
        title="GB grid frequency — live control chart"></iframe>
Contact
hello@spcvisuals.com — a person reads it, usually within a working day.